Hanse 388 Real-Life Performance
With a few hundred million more speed and wind data points in the database, here’s some fresh sailing performance data, and some humble guesses as to what it all means.
Preamble
From a cruising customer’s point of view, it is not easy to get a good understanding of how different boat models perform in different conditions, and how they compare to each other.
Most manufacturers do publish at least some polar performance data (and Hanse is doing quite well in this respect!), but the published data is usually valid only for very specific conditions. Also, it seldom includes much detail about exactly what these conditions are. (To replicate the results and calculate your own, you would need the base parameters and of a copy of ORC’s VPP software, which is 600 € a year.)
In an ideal world, I think ORC should cooperate with manufacturers so that on the Hanse site (for example), you could configure your boat, add crew and captain, sailing gear, food and beverages (a bottle of Champagne to celebrate what a nice boat you have!), pots and pans. Then, click on a large blue button to generate polar data for the boat in exactly the specified configuration.

In this same ideal world, there would also be a lot of actual, measured performance data to verify and improve the theoretical estimates. And to show what kind of performance real everyday people (like us) get out of their yachts.
So, back to the now and the much-less-than-ideal world. Here’s some of the data we managed to collect during our previous season.
Off to a Flying Start!
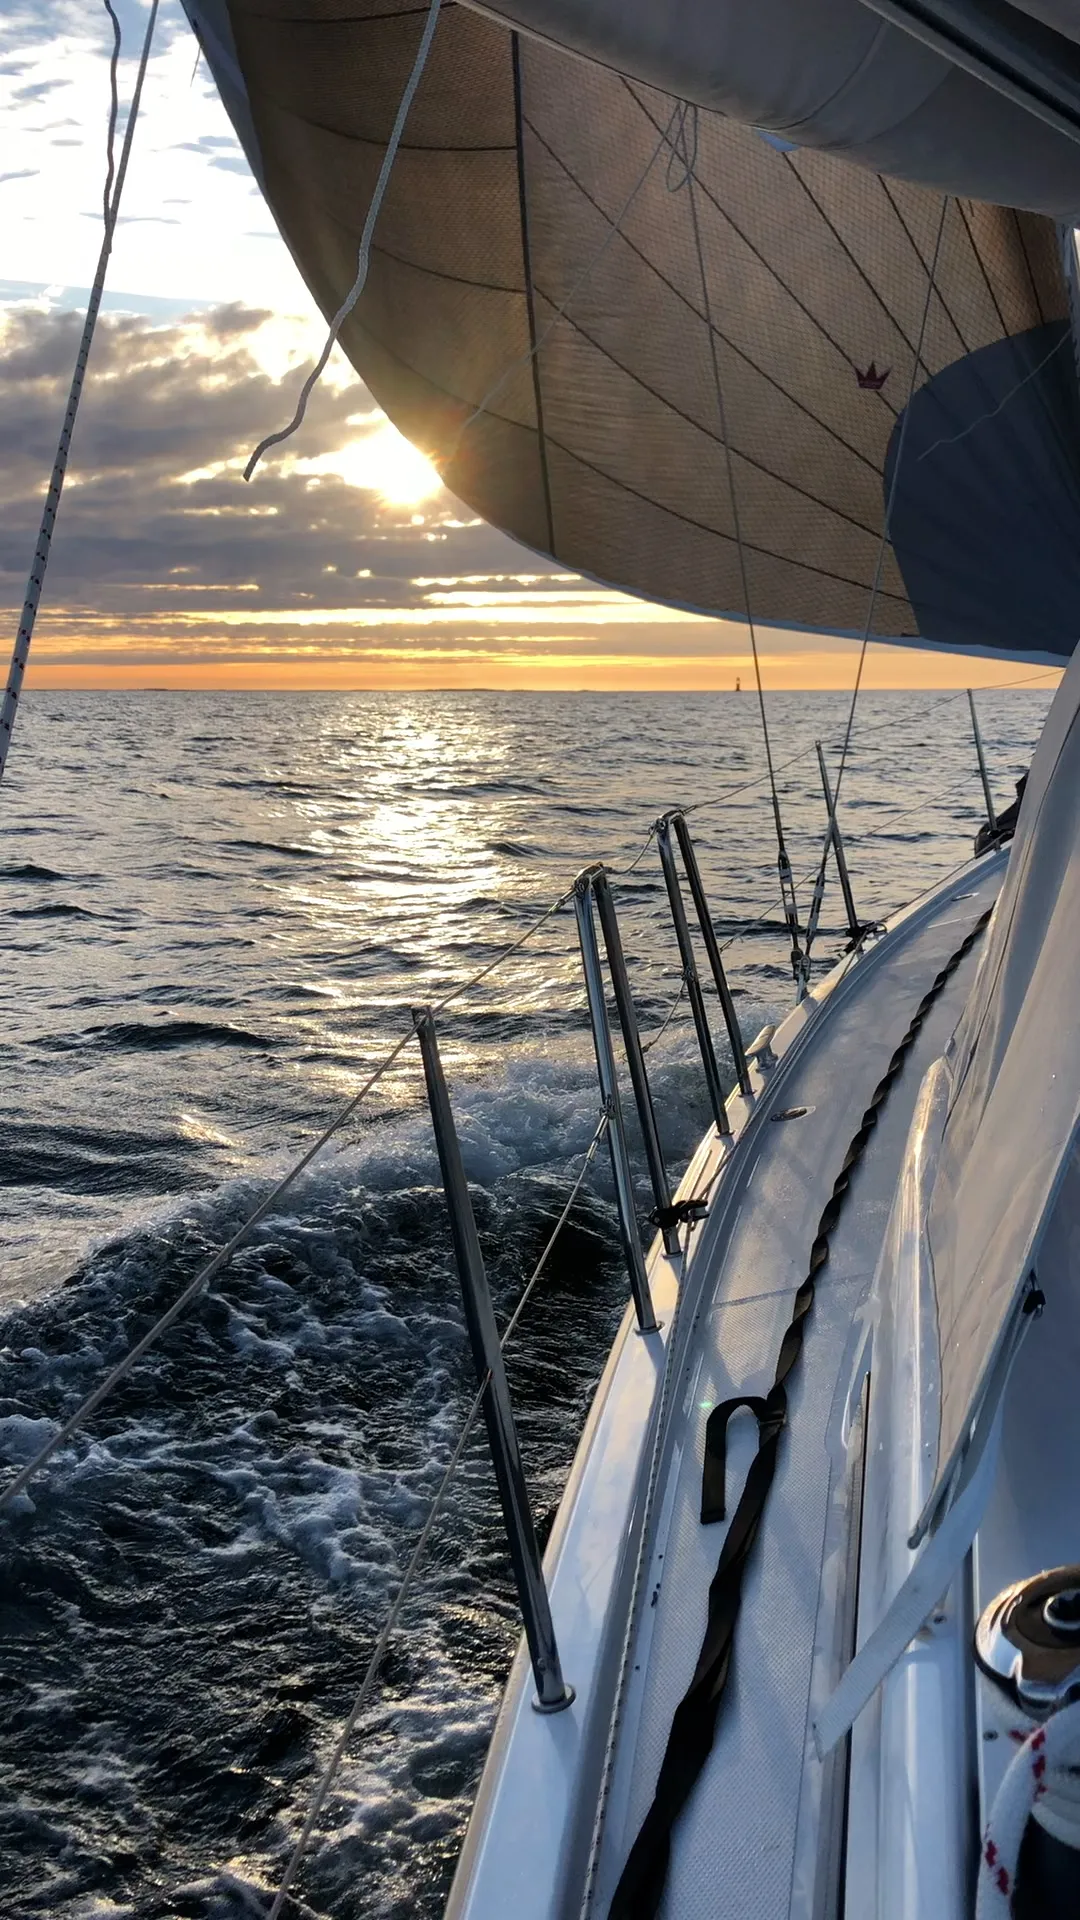
I picked up the boat in late March and we had some great (although also cold!) sails during the early spring months.
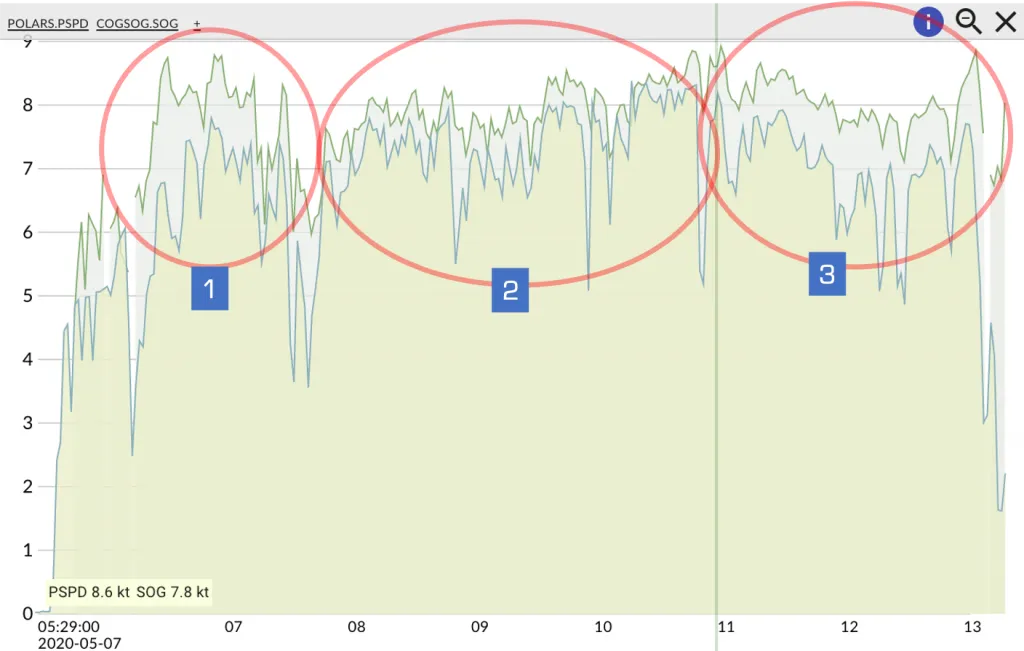
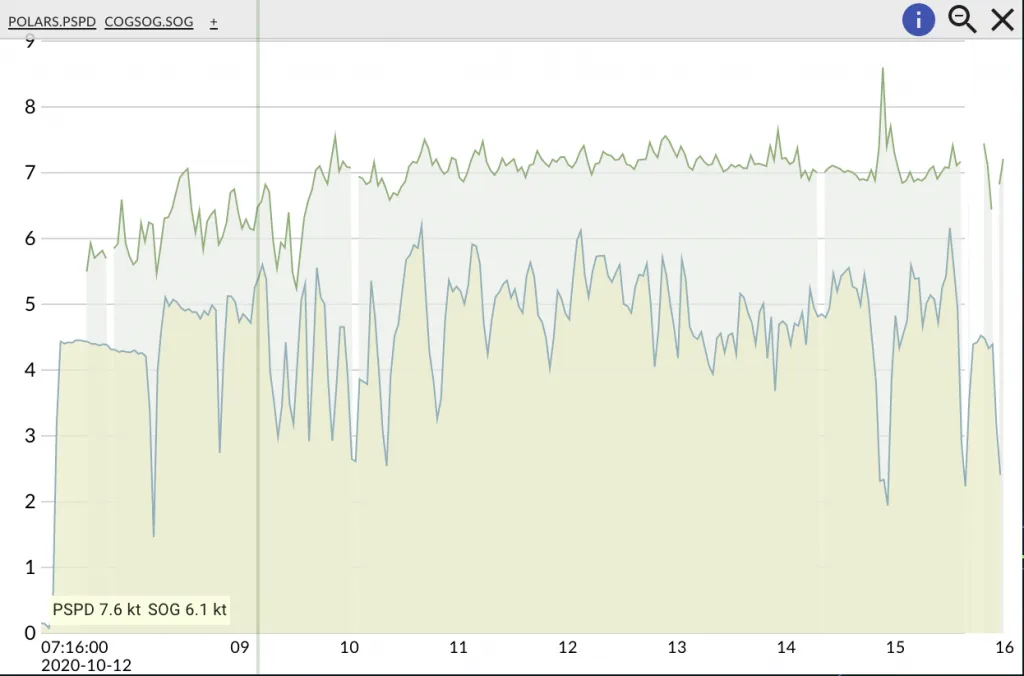
The very first sailing data is from April and a short trip to a nearby island with J and O. In the picture below, you can see the speed profile for the whole trip.
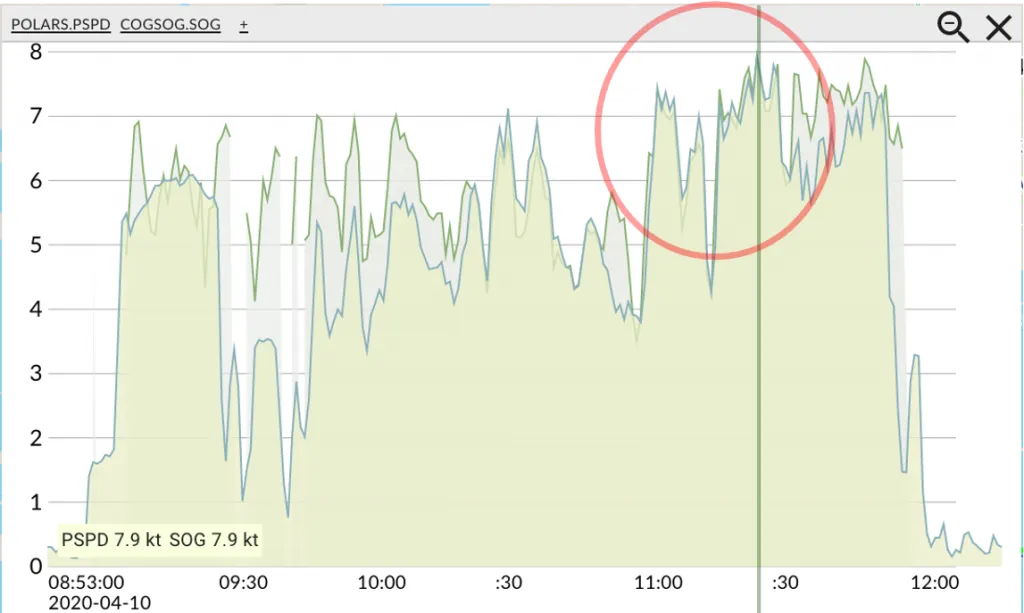
The foreground green area shows the average SOG (speed over ground) we really did. The background area shows the optimal performance, according to Hanse, for the same true wind speeds and angles that we had.
If the foreground is roughly in sync with the background (for example the area within the red circle), then our performance matches Hanse’s suggestions. If not, then we’re going slower than the theoretical suggestion. For one reason or another.
(One inline footnote here: theoretically, we should compare speed in water [from the paddlewheel sensor] to the optimal speeds, but I’m using mostly SOG here for two reasons. Firstly, the paddlewheel gets easily clogged, and for a lot of the fall sails, it reported an even zero knots. Secondly, and although I tried my best to calibrate it, it shows suspiciously high numbers. I’m happy if they are true, but I’m going with the more conservative COG numbers anyway.)
I’ve used SOG for the actual true wind calculations as well, for the same reasons as above. Again, this is theoretically not how it should be done, but since we have rather mild currents and almost non-existent tides in the Baltic Sea, it’s not terribly wrong either. End footnote!)
99% – 101%!
Looking at the red circle in the first image (1), the boat was flying! Having sailed a lot of our first season with an overpopulation of barnacles living on our bottom, the boat felt totally different. Lighter, more nimble, and very much quicker in the accelerations.
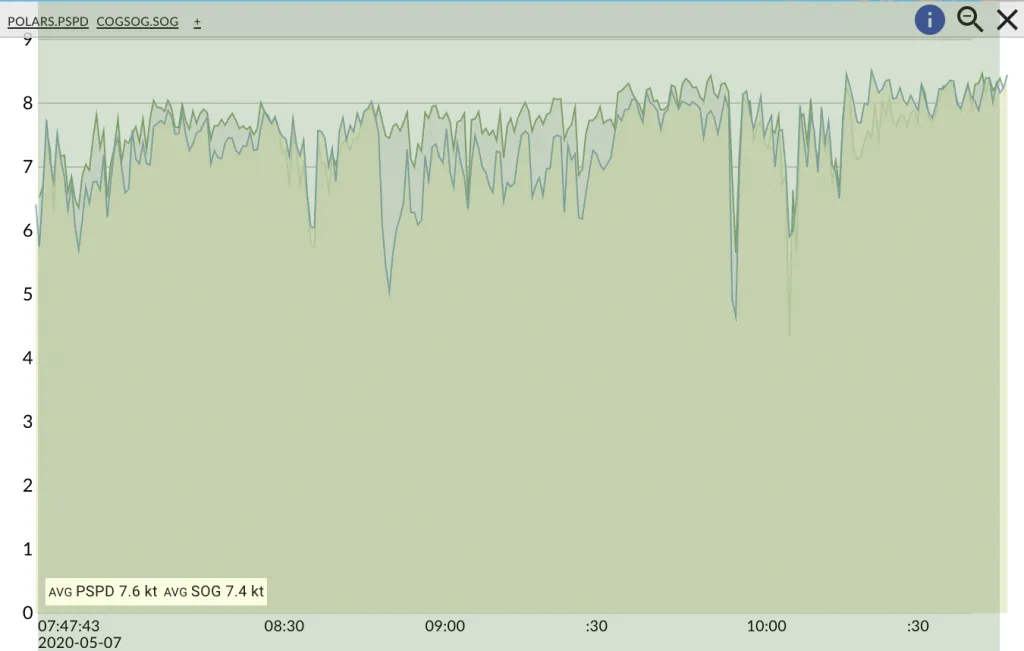
Here’s a zoom-in on the “flying”. About thirty minutes of sailing, where we are matching Hanse’s advertised performance exactly! (between 99%-101%)
Comments:
- It was actually quite easy to achieve what Hanse “sells” in their performance documents.
- A clean bottom helped a lot!
- Having a light boat helped a lot. Taking into account the life raft, dinghy, other stuff, and the people aboard (me, J and O), we had roughly 300 kg extra weight aboard. On the positive side, because temperatures were still dropping below zero in the nights, we had an empty water tank, which all filled up would have been about 295 kg.
Solo Sailing – Still Quick
In May I did a nice solo sailing trip to the eastmost Åland archipelago.
The bottom of that boat was, I think, still quite clean and slippery. The biggest difference to the previous configuration was that I had a full water tank and more food, so all in all (minus J and O) a net weight increase of about 240 kg.
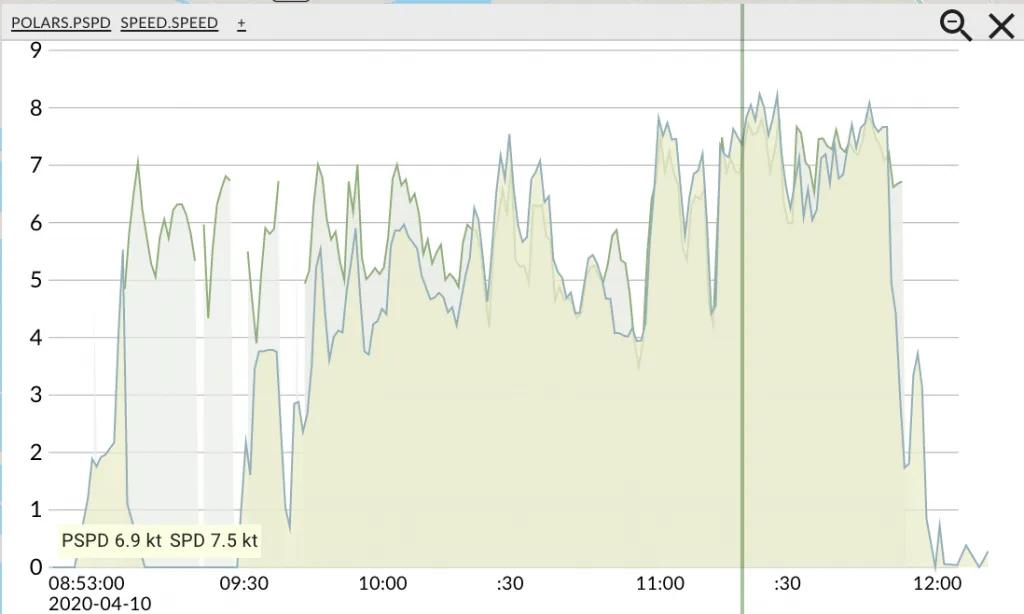
Here’s the data from Turku to Åland.
Red Circle #1 – 84% with the wrong sail
Inside the first circle, I was pretty far from Hanse’s optimal performance. In fact, during that time Hanse’s theoretical boat would have averaged 8.0 knots but I did only 6.7, so only about 84% of the theoretical speed.
The reason for this big gap was quite simple, though. During that time, the average true wind angle was about 119 degrees and while the theoretical boat (rightly) was using a spinnaker, I was sailing with the standard jib. (At the beginning of that section, I was actually about to hoist the crossover/code zero, but a couple of gusts to 16-18 knots, and I didn’t do it.)
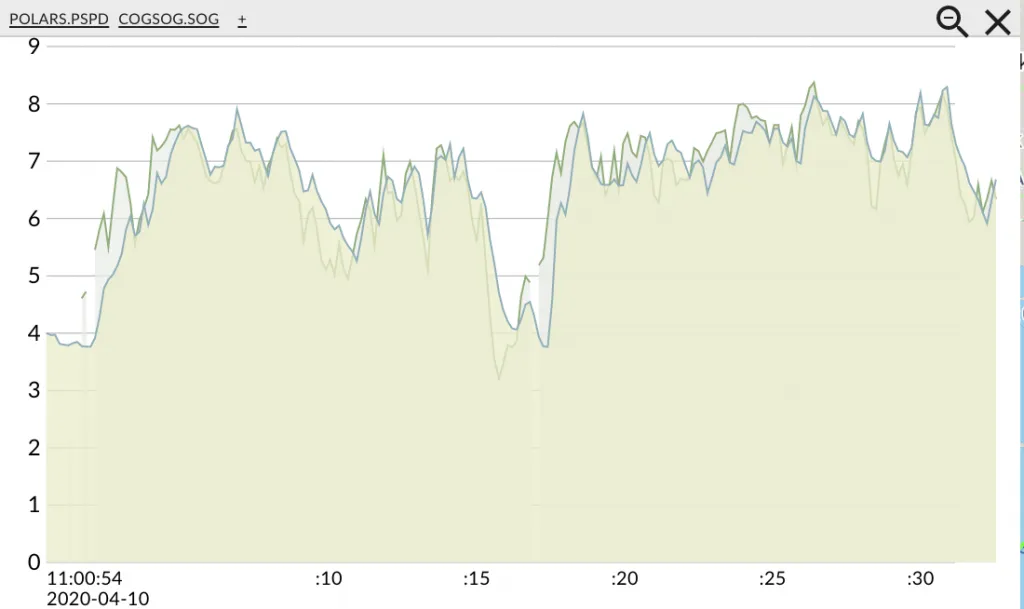
Red Circle #2 – 95% with the right sail
Inside the second circle, the true wind angle was roughly about 80 degrees, and the difference between the optimal speed and my speed was much smaller: Hanse’s speedboat averaged 7.9 knots, while I was doing 7.4 knots — about 95% of full speed!
There was still a small apples to oranges issue there, however. Whenever the true wind angle got over (about) 75 degrees, Hanse’s one-man theoretical crew was quick to hoist their spinnaker, while I was left dumbfounded with only my small jib.
So, here’s the second circle zoomed in, and comparing to the optimal Hanse 388 with just a jib.
And, rather nicely, I was averaging 7.4 knots, or about 97% of the theoretical target.
Red Circle #3 – 87% with waves and a reef
At the beginning of the third circle, I again dropped away from the target speed. This happened for two reasons: 1) I entered a stretch of open sea with oncoming waves, and 2) the true wind speed increased to over twenty knots, and I put in a reef.
Here’s that section in more detail.
On average, I sailed one knot slower than the theoretical target: I did 7.0 knots, and it went 8.0 knots, so I was at about 87% of optimal speed.
Comments:
- Even with a full tank of water, it wasn’t too hard to attain decent and close-to-advertised speeds.
- Oncoming sea slowed down our real-life boat while (I think) sea state isn’t accounted for in Hanse’s performance data.
- Sail configuration (obviously) affected the comparison a lot: when the Speedy Hanse was using a spinnaker and we weren’t, they sped away. Likewise, when they could continue with a full main and I couldn’t, they were quite a bit faster.
Crossover vs Spinnaker
During the sail back, I got to use the crossover sail over good angles, and here is the data from that.
95%!
The first part, up until about 11 o’clock went really nicely! My speed was on average 7.1 knots where the (spinnaker yielding!) optimal boat would have done 7.4 knots, so I was at 95% of target speed!
After 11, the track turned too much downwind, so I furled the crossover and continued with just the main. They, of course, still had their spinnaker up, so that’s where they left me high and dry.
Comments:
- With good wind angles, the crossover/code zero is a really good sail, and the less than 0.5 knots lost to the spinnaker are easily gained in the comfort of use!
- When going deeper than roughly 140 TWA, the crossover collapses where a spinnaker wouldn’t.
Fully Loaded … and Slowing Down
A couple of months later we loaded everything we had and ourselves (two adults, four children, a dog) aboard the boat, and left for our summer vacation sail.
I’m sure that we already had a small amount of gunk on the bottom when we left, but the biggest difference was certainly in weight: from the initial extra 300 kg, we were now at maybe an extra (never ideally positioned) 800 kg.
77-84% Upwind
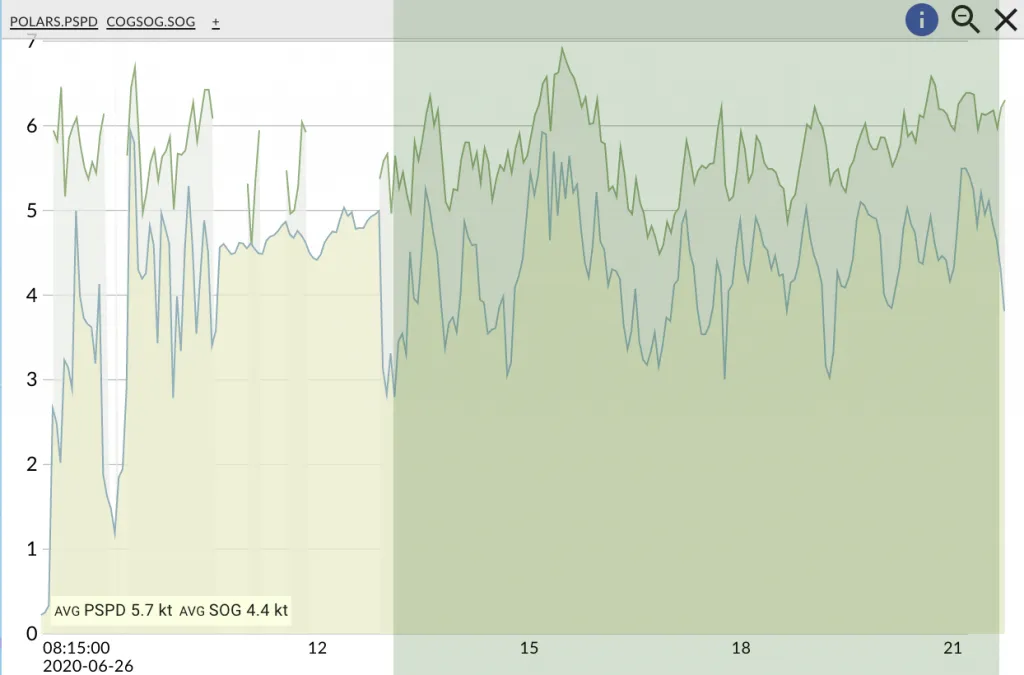
The gap between Speedy Hanse and us was quite big. On average (the selected area) we were going 4.4 knots while Speedy was going 5.7, so we were only at about 77% of the target speed.
Removing the slowing down during tacks and only looking at speeds between those, we got up to at most 84%, so still more than 15% slower than Hanse’s numbers.
And a couple of weeks later, no better certainly …
76% Upwind
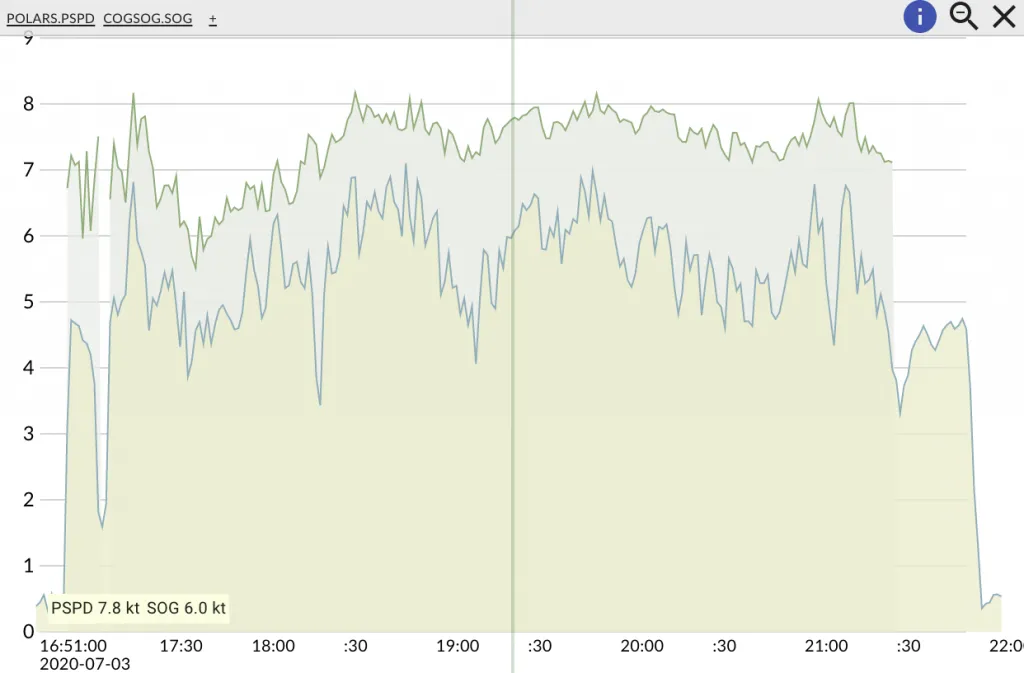
Here we were only 76% of the optimal speed. Where the cursor is, we should have ideally sailed 7.8 knots, but we did only 6. There was good deal of leftover (annoying) swell from an earlier weather system, though, and that did slow us down some.
83% Downwind
Fast forward a couple of weeks again. We had some lighter winds in between, with quite a bit of motor sailing, but on our trip from Hel to Klaipeda, we had both enough wind and too much of it.
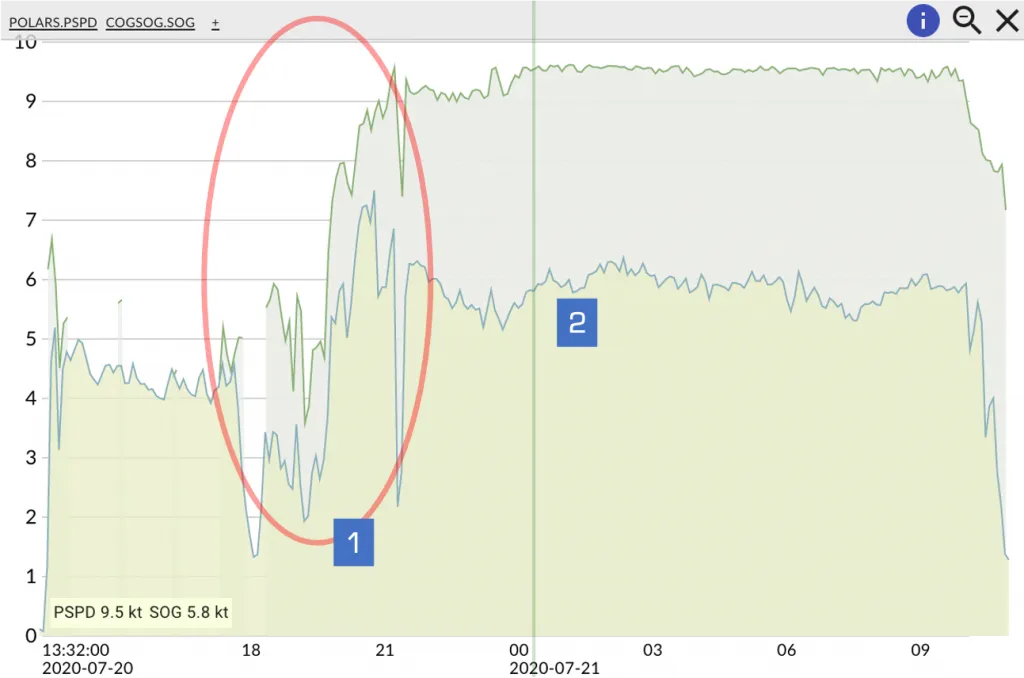
In circle #1, the wind picked up, and we had an exciting time going downwind with the crossover sail. Here’s a zoom in:
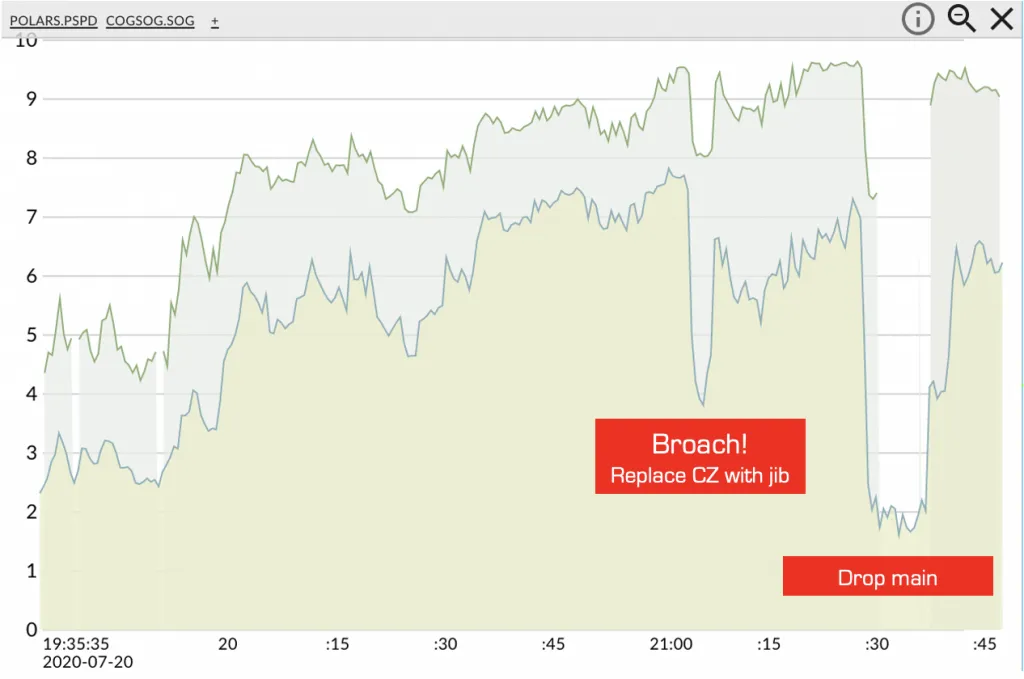
Looking only at the last twenty minutes before our broach, we sailed on average 7.2 knots, while the theoretical Hanse (with its theoretical spinnaker) sailed 8.7 knots, so we were at only 83% of the target! Even when I compared our speed with the jib-only Hanse, they would have gone 7.4 knots, so faster than we did.
Commentss:
- Weight matters, a lot! Having the weight positioned in the wrong places (ie people and stuff on leeward side when going upwind) matters as well.
- After four months in the water, I’m sure the bottom wasn’t totally clean, but I have no idea of how much more friction we were causing compared to earlier in the spring.
- When we lifted the boat, we discovered that the saildrive rubber boot had broken. I don’t know when this happened, but it was certainly adding to the drag.
- The speed differences were quite significant, around 1.5 knots in absolute numbers.
The End of Season 2
Towards the end of the season, in October, I did some more solo sailing with the same setup I had in the spring.
- Less weight aboard (just me, myself, and I with my stuff), comparable to my May sailing trip.
- Likely much more growth on the bottom (the paddlewheel speed sensor had stopped moving altogether).
- A broken saildrive rubber boot, adding to the drag.
75%
Not very good, unfortunately. During the stretches where the actual speed was the closest to the target speed, I was still averaging only about 75%. (The cursor in the picture has landed on a good spot, with a slightly better ratio of 80%).
Comments:
- After 7-8 months in the water— and the bottom fouling accordingly— and with a broken rubber boot, it was quite impossible to achieve the good speeds of early spring.
- The sea, and sailing on it, was still as beautiful as ever, luckily!
Conclusion
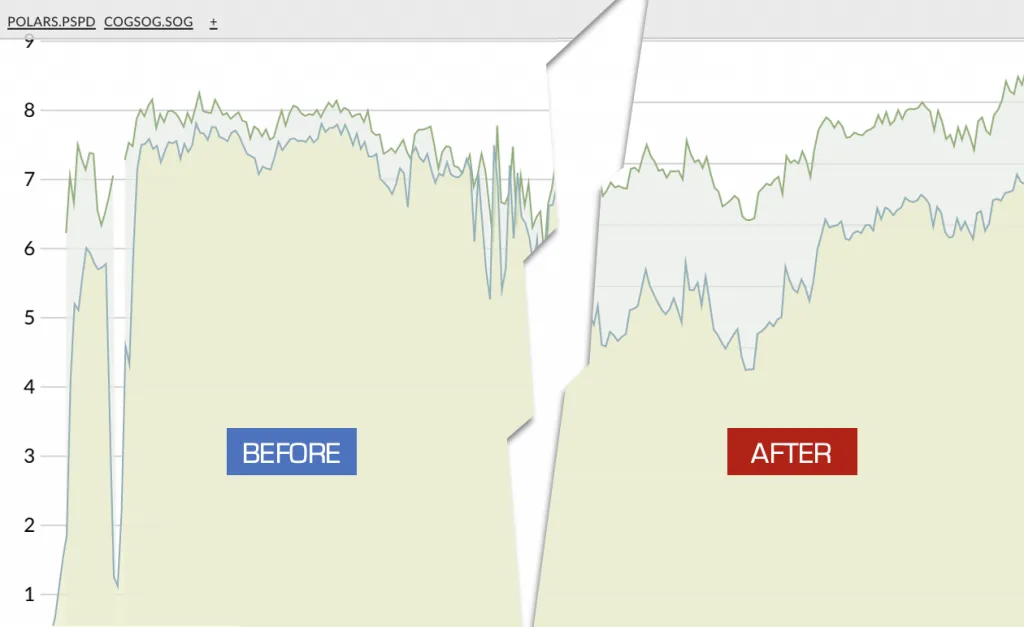
It’s obviously a bit frustrating (and even a bit depressing!) to see the negative development in speed, from the start of the season, in March, to the end of the season, in November.
On the other hand, it is wonderful to see in the data, what felt evident when sailing: we were really flying in the early spring (woohoo!). And yes, it really was much harder to get that same groove going, later on.
So, here’s my recipe for next season:
- Get a good replacement for that (slightly problematic) rubber boot.
- Make sure that the bottom antifouling is up to scratch. There had apparently been some patches with (perhaps) poorly mixed paint (the yard told me), but those will be fixed before next season.
- Continue to log everything, but don’t wait until (next) winter before looking at the data.
- Take the whole family with dog and stuff for a sail early on to get a performance baseline with everything and everyone aboard. (Or if they think it’s waaaay too cold, take a similar amount of Champ.. err something else, and do it solo.)
- If it seems like we’re going slower than we should, figure out why, and try to fix it.
- (Figure out an inexpensive way to clean the bottom if it gets gunky.)
- (Trim the sails better)
The good news is, that the potential is really there, and when the settings are good, liftoff to flight mode is certain. (Yes, I have indeed been watching too much of the PRADA cup.)
Circling back to the beginning of this post, one further thing struck me.
When comparing the published 388 performance data to that of the bigger Hanse models, the bigger models’ polar speeds aren’t that much faster than ours. But, if we add our constant weight (we, the people, with the same amount of stuff) to a much heavier boat, the proportional impact on the total weight— and I assume speed— will be smaller. So, getting from A to B with a Hanse 458 (for instance) should, I think, be quicker than suggested by just comparing the performance data.
This is, again, one more reason for the manufacturers to implement dynamic online polar calculators, where the customers can enter their own custom settings and get better graphs out of it all.
Cheers, until next time, and thank you for reading!
P.S. If you are on Facebook, follow our page and help us get through the winter in good company! 😊✌️