Hanse 388 Speed and Polars
So, how fast does our Hanse 388 go? This summer, we gathered over twenty million data points to compare our sailing speeds with what HanseYachts’ marketing material had promised. Here are the results.
EDIT!
- Updated performance data from early 2020 over here in this post: Hanse 388 Performance 2.0.
- Updated performance data from late 2020 in this post: Hanse 388 Real-Life Performance.
Our Data
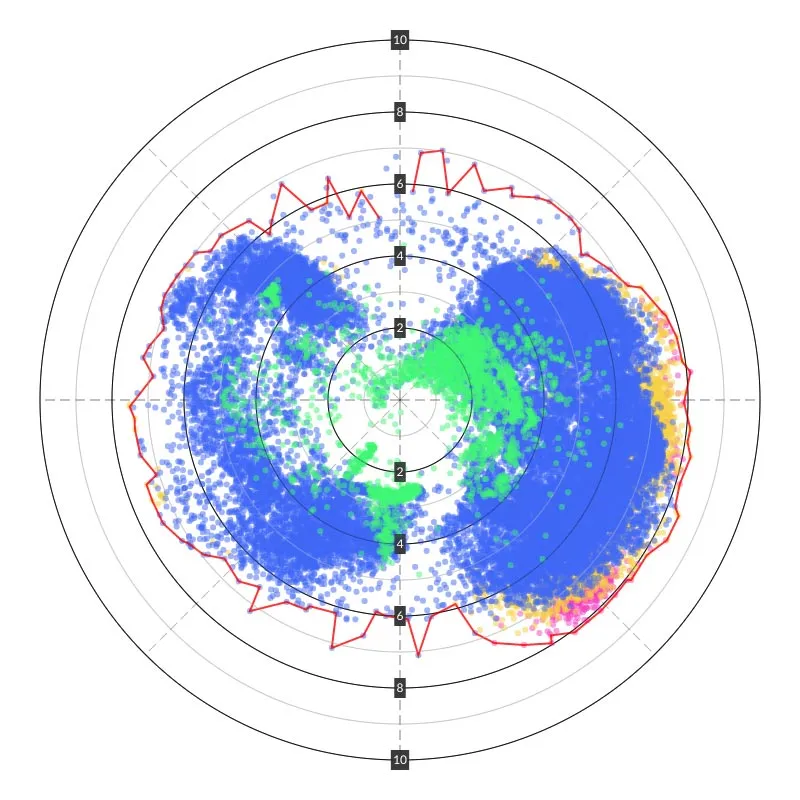
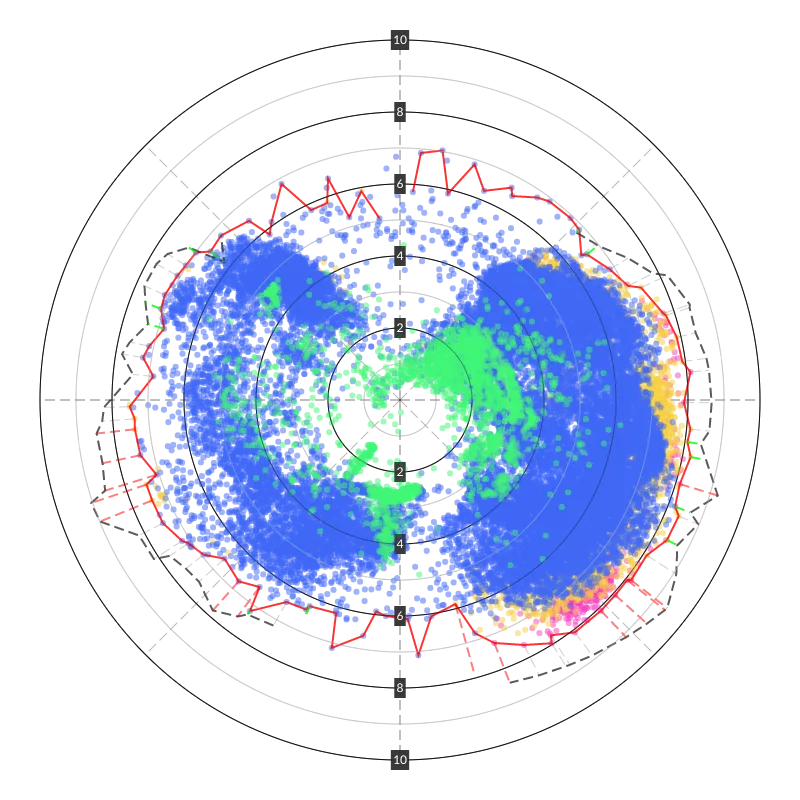
Our boat recorded (among a huge number of other things), speed, course, wind angle and wind speed roughly ten times per second, for the whole summer.
Each point on the graph represents:
- sailing with a particular speed (in the middle 0 knots, on the outermost circle 10 knots),
- at a certain (true) angle to the wind (straight up on the circle is directly against the wind),
- at a certain true wind speed (blue: 0-6 knots, yellow 15-20 knots, purple 20+ knots)
The surrounding red line shows the maximum speed for each angle (averaged for three degrees).
Looking at the picture,
- We sailed much more with the wind coming from starboard! Funny. My friend said we”used the boat unevenly” 😄
- Sometimes we got a bit over eight knots, but the bulk of our sailing was between 4 – 7 knots, maybe 4 – 7.5 knots with the wind from starboard.
Compare to What?
It isn’t that straightforward to know what to compare to.
HanseYachts publishes polars for the 388, but they are made with a sail configuration that Hanse actually doesn’t sell (jib + spinnaker). In the same diagrams they do include polar data for using just the jib, but since we have the crossover / code zero sail, that’s not totally comparable either.
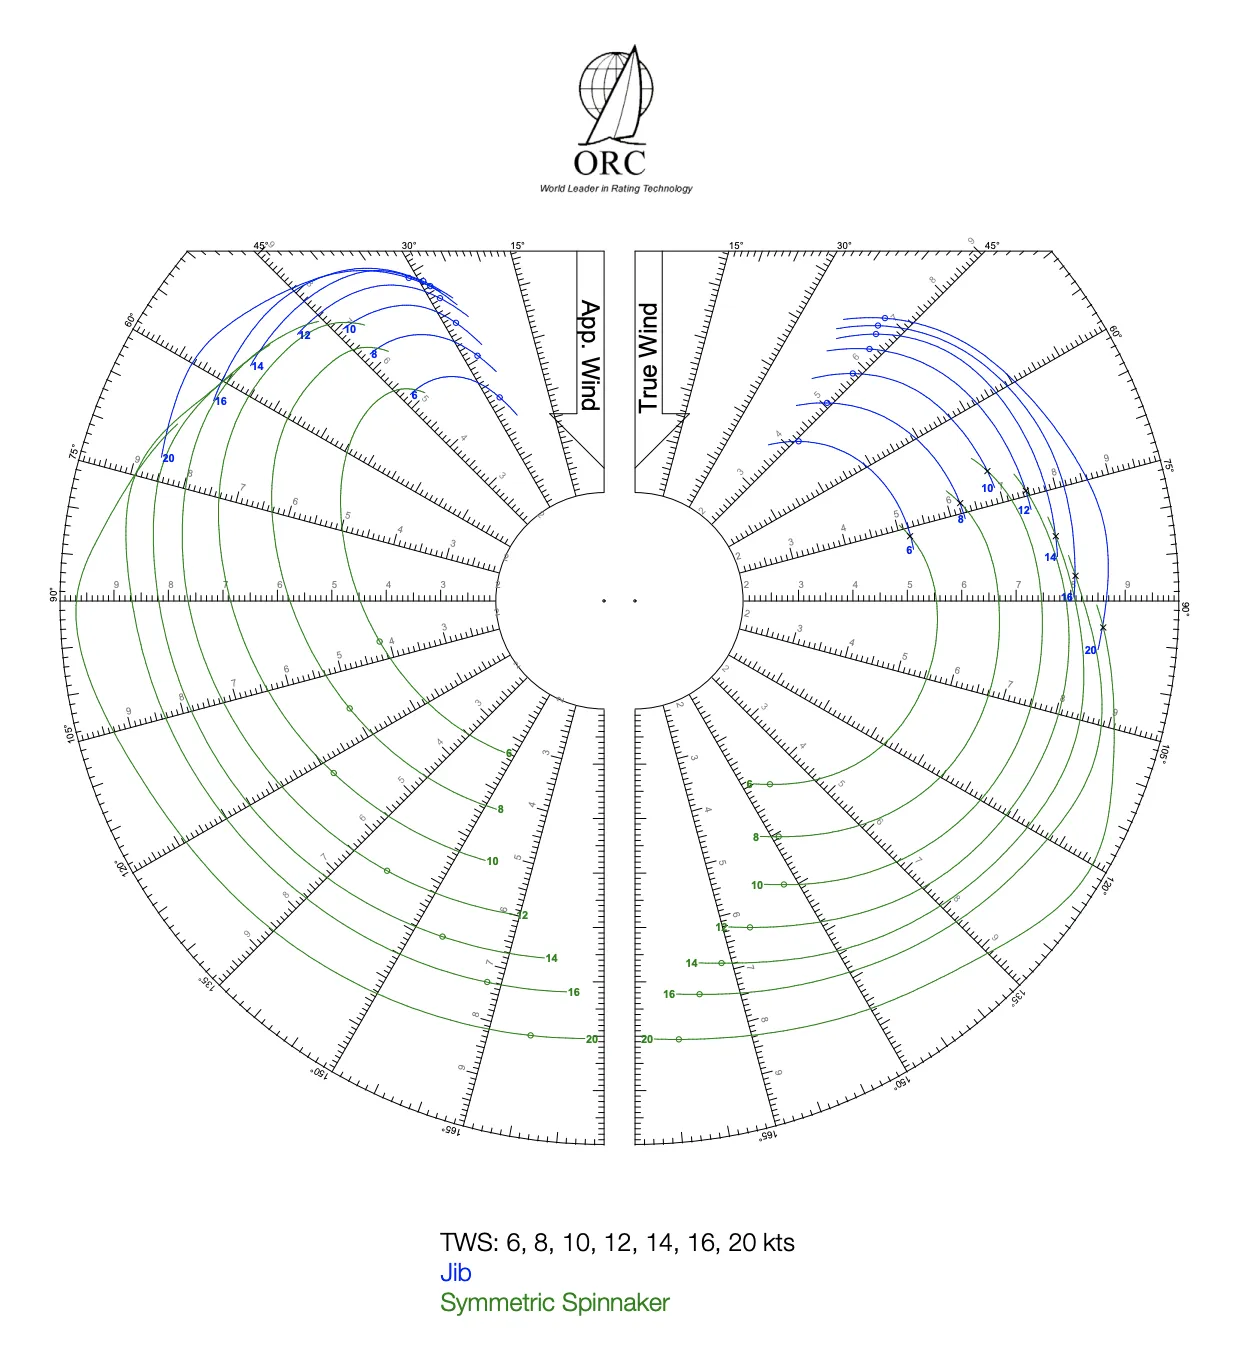
There’s also the ORC database, with a lot of boats, and fortunately they do have one Hanse 388 there. It seems lighter (=quicker) than ours, though. And it carries a different set of sails than any of us.
So, comparing apples to apples isn’t that easy. With this in mind, though, here’s what I came up with.
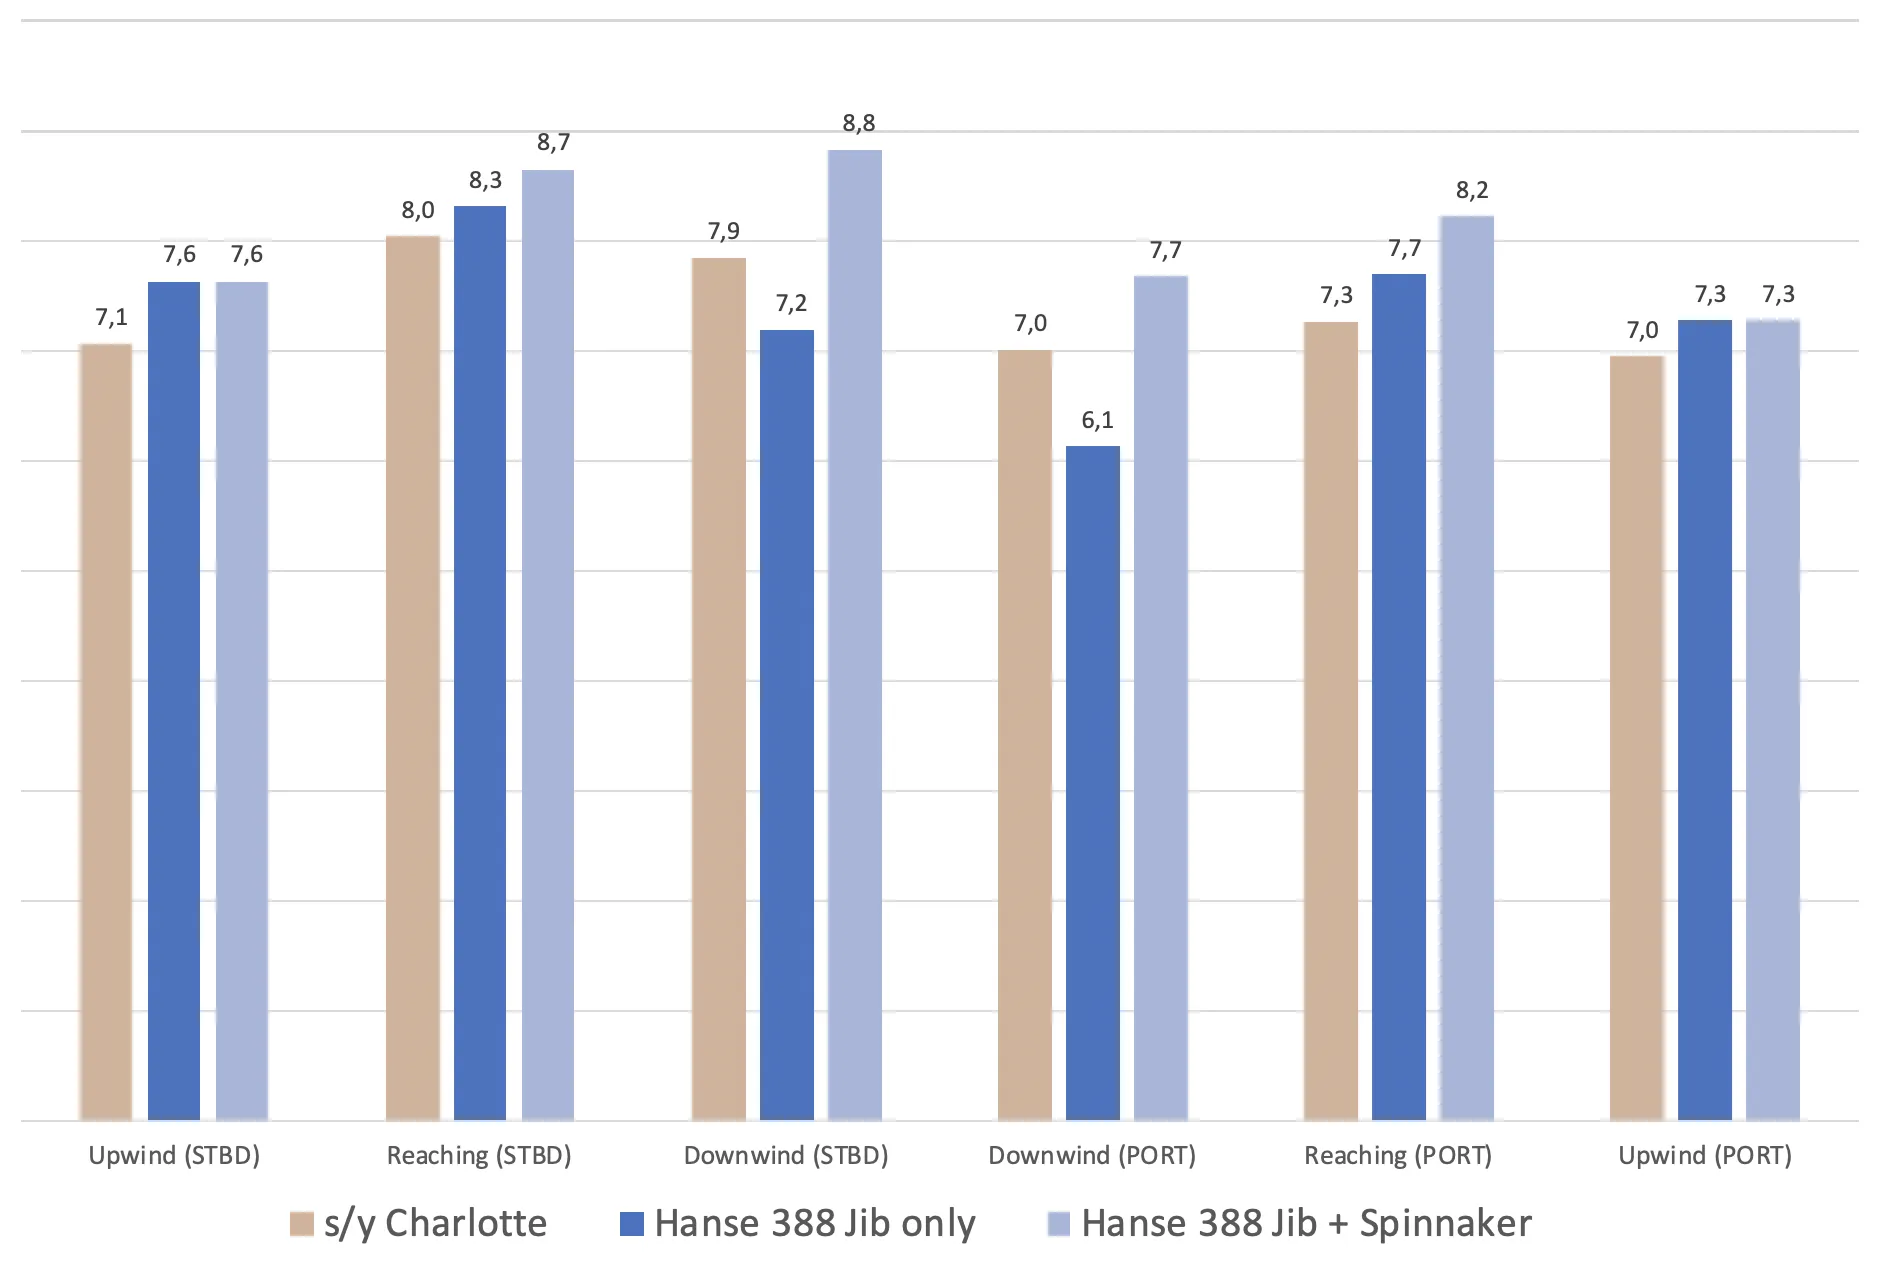
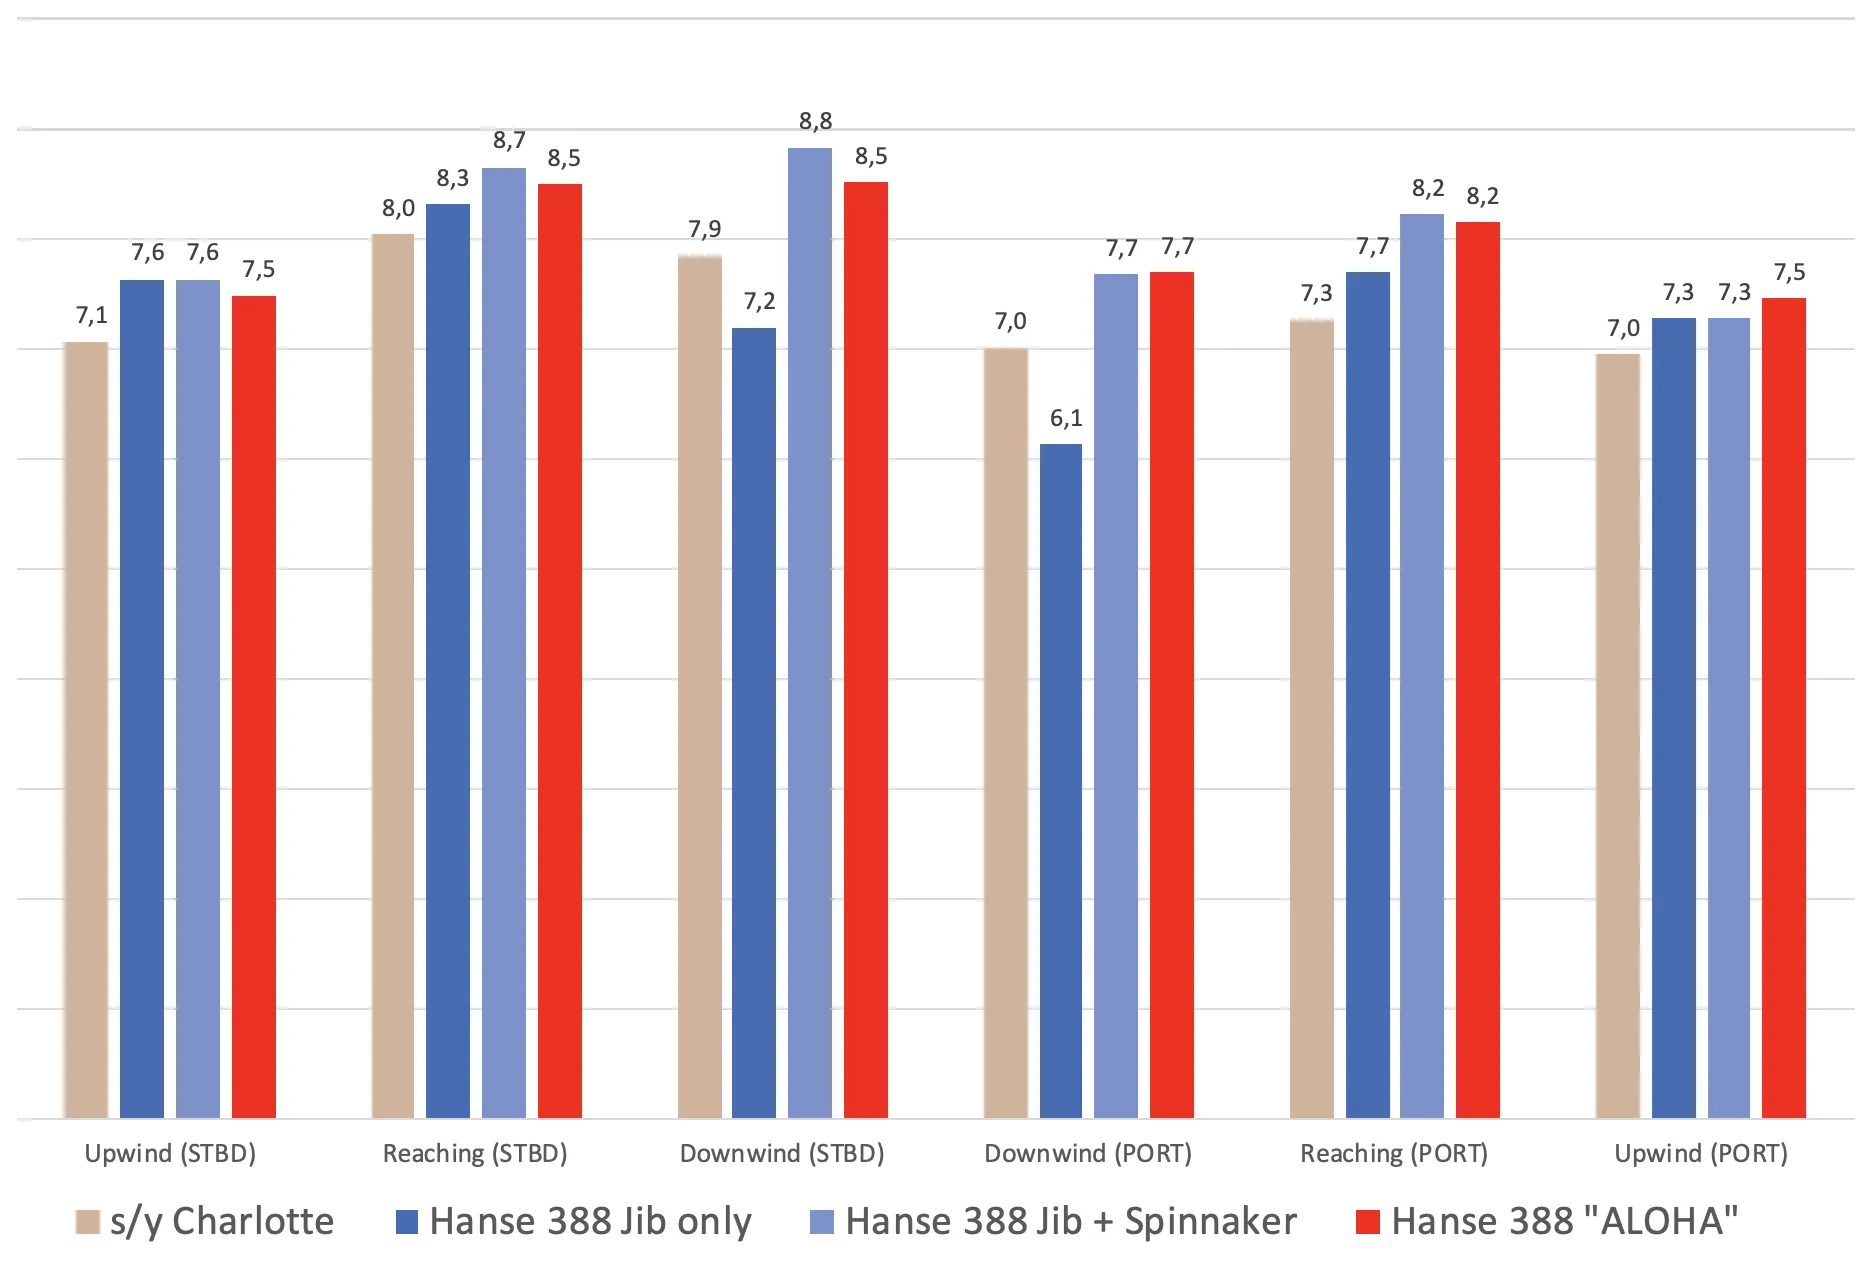
s/y Charlotte vs HanseYachts’ Polars

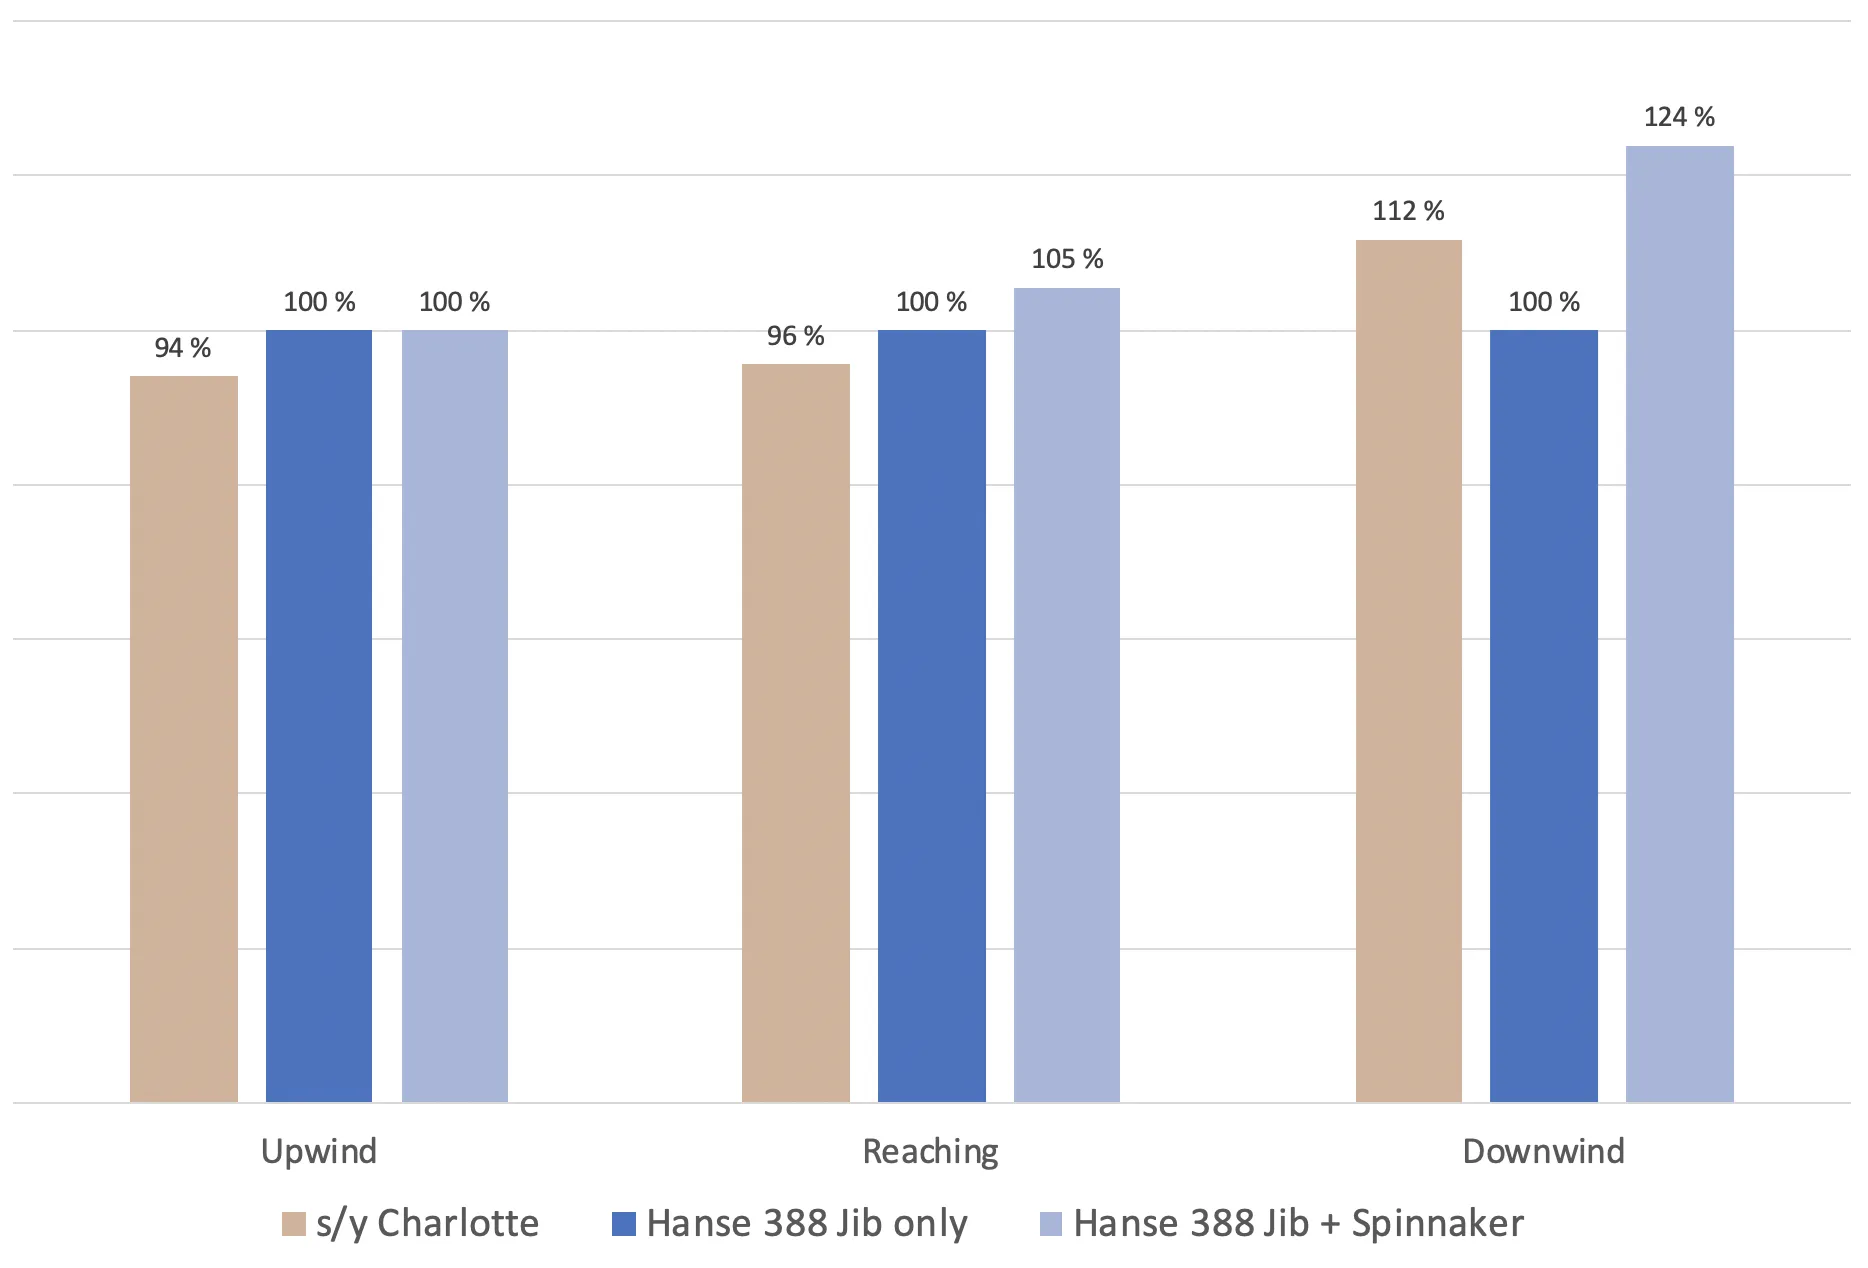
There’s a lot of averages of averages here, but bottom line: compared to the jib only Hanse polars, we did 94% of its upwind speed, 96% when reaching, and 112% (cheers! so long! see you later!) when going downwind.
Compared to the jib + spinnaker polars, we did the same upwind, but about 90 – 91% of the reaching and downwind speeds.
If we average all the wind angles, we were exactly as quick as the jib-only Hanse, and 9% slower than the jib+spinnaker Hanse.
It’s quite encouraging, actually. Not at all crazily far from what was advertised!
So, if you sail with a jib and a crossover sail, load your boat with a dinghy, life raft, four kids, two adults and a dog— and are just very ordinary everyday sailors like we are— you can expect something like 90-94% of the speed guide Hanse is showing.
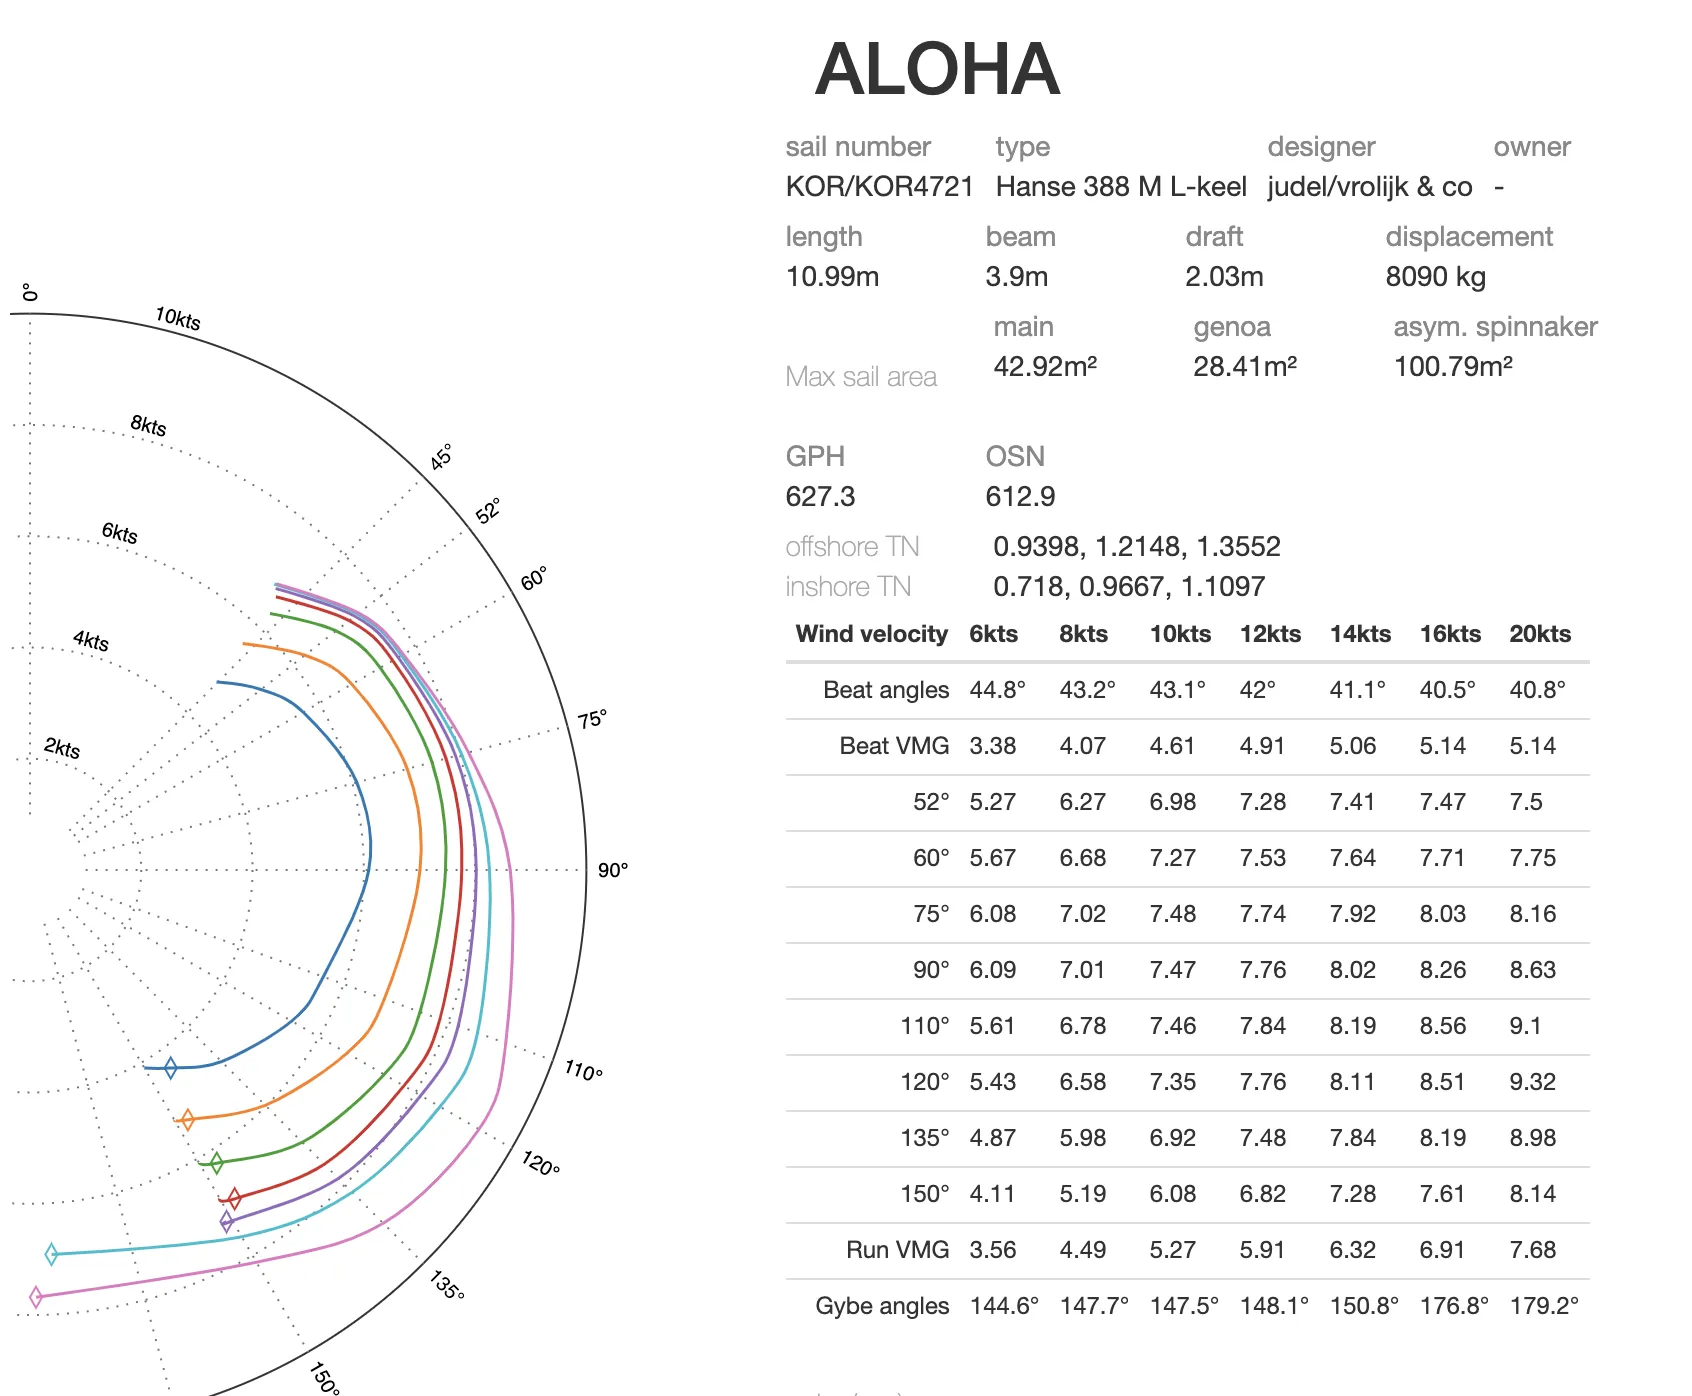
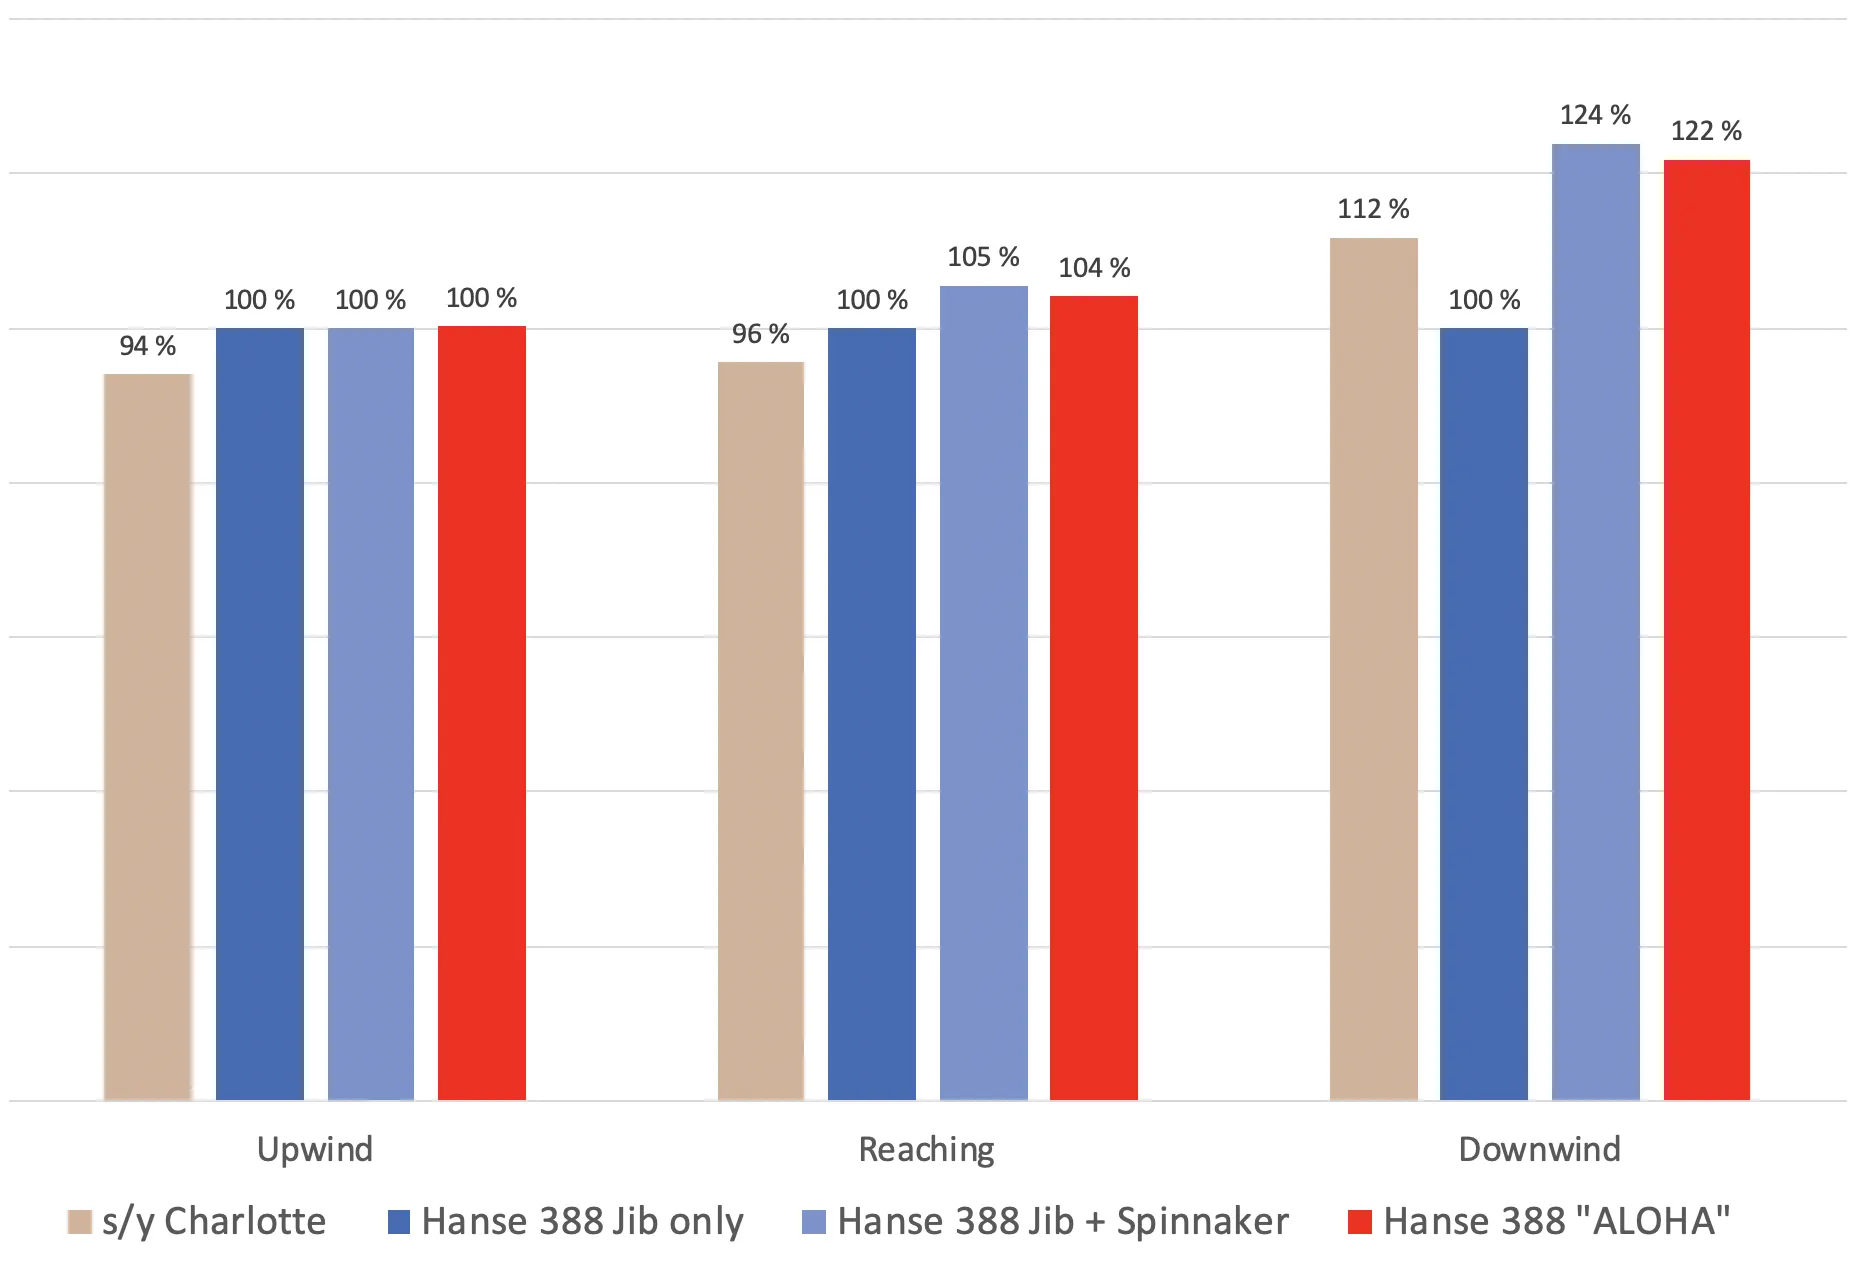
s/y Charlotte vs Hanse 388 ALOHA
There is just one single Hanse 388 that has gone through the ORC certification to get their “racing” polars. This is Hanse 388 ALOHA.
Here is how we compare to them:

Conclusion
I started out thinking that we would be way way slower than Hanse’s official speed guides (polar diagrams).
Looking at the data, however, I think we did pretty well!
During our summer sailing, we paid much more attention to keeping the kids (and the dog) happy than to sailing speed. And we had a huge load of barnacles attached to the bottom for at least some of the sailing.
Se, getting to about 90-94% of advertised speeds (with less sail area!) is certainly good enough for our first season.
Next season, we’ll aim higher! 🤘
P.S. Hanse, I wish you would supply speed guides for the sails you really sell (the crossover!). It would also be nice to know the base parameters (boat weight!) for your calculations. Please send them over! 😄
16 Comments
Awesome post, very interesting. Never thought about collecting all of the data for this purpose. The only thing I have thought about is collecting data, so I can just look at the wind angles and speed so that I know how much sail to put out before I get them out.
All the best, Chris and Tanja
Thanks!
And yes, it's really interesting to figure out how well/quickly we really go. Originally I wanted to do this to have some targets when trying to get better at it :)
All the best to you as well! Mikael & Charlotte
Great job , very interesting ! Max
Thank you!
Mikael
What an excellent article! I’ve never seen any that kind of comparison of the speeds achieved with any boat model. This kind of data might also be interested by some marketing specialists by yacht manufacturers. Hanse 38x might be the yacht model for our family in future and this article gave us a lot of perspective to our procuring prosess. Have a nice winter time and ”launch day” waiting for you!
Petri & Elina from Turku
Cheers!
I'm sorry to say I _just now_ discovered that Wordpress has decided that this great comment was SPAM :(.
Thank you!
Hi Mikael, How did you do this data capture? Is this build into the Zeus3? Waiting to take delivery of our new 348 in april, and would love to do something like this.
Cheers!
The data is actually not from the Zeus. I have a small computer (Raspberry Pi) that's constantly on and plugged into the NMEA network.
I was just thinking that it would be nice to "productify" this a bit and get someone else to test it as well. If you're interested, let me know!
Kind regards, Mikael
April is currently far away :)
I would love to play with this, i’m in the IT business my self, and do have a couple of pi’s laying around doing nothing.
Feel free to e-mail me directly.
Best regards Peter
Hi, I have a Hanse 348, would you mind sharing how you plotted your own polars Cheers Jurgen
Hello, Jurgen!
The plot data was collected with a Raspberry PI connected to the NMEA network, and then - via a few steps - transferred to my cloud database. To actually visualize the polars I first went through all the data and marked starting, ending times for when we were actually sailing. Then I made a custom node/react program to draw HTML5 canvases based on the data.
I'm slowly progressing towards making this whole process more automatic, though. If you're interested, I'd be happy to include you in the testing group :)
HI, I'm also interested to join your testing group. I have Hanse341. And there is lot of time to build up the system during winter time. Br Timo Helsinki Finland
Great and absolutely! I'll get back to you.
Thanks Mikael for a great blog you have created and some nice tips for collecting nmea data. I was just wondering how the raw data looks like when you have data for 1/10sec, did you have to sort out extreme values, even out peaks, make average values etc? Is it possible to compare your values with Hanse yachts' polar if you have high wind gusts and surf speed?
Thanks again for sharing! Kristian
Hello, Kristian, and thank you for your comment!
And your question is obviously a good one with no simple answer.
First, here's a screenshot of some of the raw data for a few seconds. There are three different devices reporting COG and SOG here. The SOG is in m/s so 2.42 m/s => 4.7 knots.
<img src="https://storage.googleapis.com/naked-sailor.appspot.com/public/cogsog_raw.png" alt="" />
The performance values in this post (and the newer one) are all six-second averages (if I remember correctly) so that's the most straightforward adjustment to remove some of the instrument/sensor errors.
If the objective is to produce a good picture of "how the boat really sails" -- and I think that is a good objective -- some further "intelligence" might be good to add:
- Remove outliers. There aren't a huge amount of outliers but there are some for sure. Sometimes the GPS speed jumps to 400 knots for a few tenths of a second, and that's probably not real :) - Figure out a way to describe and visualize momentum. The wind accelerates quicker than the boat, the boat decelerates slower than the wind. For some calculation (not these) I think I selected "good polar points" based on the speed of the boat and the wind being within +/- a certain percentage for a certain period of time. - Figure out how to better account for waves, but the ones slowing us down and the ones picking us up for a surf. - For our boat: get reliable boat speed in addition to COG/SOG. It's frustrating how easily the boatspeed sensor paddle gets stuck :/ - (A lot of other parameters, sails, weight, etc)
It's fun to compare what we do with Hanse's polars (and even more fun when we do better!), but it really interesting to try to figure out a way to describe performance in the real world. Surfing, slamming into waves included.
Please tell me if you have good improvements to drop into the suggestion box :)
BR, Mikael
This is for sure not straight forward. I'm not not very good in pi programming (even though I have a victron OS on a pi up an running in my Hanse 370), but I've been thinking about how to sort the data based on nmea input. I see that 'yacht device' has some reasonable priced voyage recorders and gateways that will do the Job, but analyzing the data will have the same challanges. I will leave you a message if I come up with any nice improvements.
Thanks again,
Kristian